2013 Regional Corn Fungicide Summary
LEXINGTON, KY.
For a number of years, the Corn Disease Working Group has shared
fungicide results from university trials across many US states as well
as Ontario. These results have been compiled each year by Dr. Kiersten
Wise of Purdue University. Here are two highlights from the results of
442 test comparisons conducted in 2013.
1. As in years past, early applications (V3‐V7) seem to have little
yield benefit (Table 1). In contrast, the average yield response to a
VT/R1 application was close to a breakeven point. There may be
individual cases where meaningful yield increases occur in response to
an application at V3‐V7, but I am aware of no guideline that allows for
prediction of those cases which will exhibit an economic yield response
from an early application.
2. As in past years, a greater yield response is seen from a
fungicide application in fields with higher disease pressure (Table 2),
although the difference wasn’t as dramatic in 2013 as in some years.
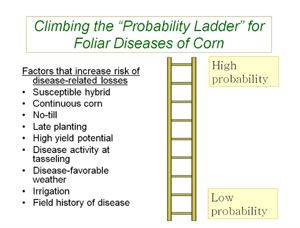
Results such as these reinforce the value of allocating fungicide
applications to fields with the most risk from key foliar diseases
(Figure 1).
Table 1. Mean yield response to fungicide application at various growth stages in corn
* Mean calculated over all fungicides compared in individual state trials
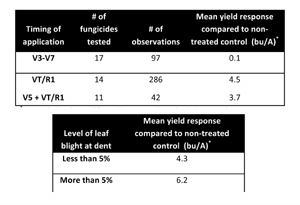
Table 2. Mean yield response to fungicide application in corn with differing disease levels
*Mean calculated over all fungicides
compared in individual state trials. Only applications made at VT/R1
were included in this dataset.
Figure 1. Risk factors for
gray leaf spot of corn. For the most part, the same risk factors apply
to northern leaf blight as well.
Acknowledgement: Thanks to Kiersten Wise (Purdue University) for reviewing a previous draft of this article.∆
DR. PAUL VINCELLI: Extension Professor and Provost’s Distinguished Service Professor, University of Kentucky