Agriculturalists Learn About Soil Moisture Sensors By Doing
PORTAGEVILLE, MO.
Participants at University of Missouri’s annual Crop Injury and
Diagnostic Clinic held at the MU Bradford Farm near Columbia, Mo. had a
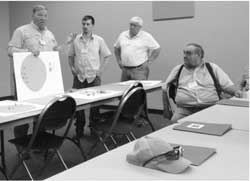
chance to teach the teacher. In the session titled “Wireless Irrigation
Sensor Management”, taught by Dr. Joe Henggeler from the MU’s Fisher
Delta Research Ce-nter in Portageville, class participants in each of
the three sessions were divided up into groups of three to five. They
were given a foam board model of a center pivot irrigation system and a
set of colored push pins. The pins represented soil moisture sensors
buried at depths ranging from one to five foot, automatic rain gauges,
and field data loggers. Student teams were then challenged to design a
soil moisture monitoring system for the center pivot, by locating where
they would place sensors at and at what depth.
Prior to unleashing them, Henggeler had instructed the group on the
fundamentals of wireless sensor technology, including economic
considerations. For example, both initial system and annual costs depend
on how and where the collected field data is to be retrieved and
stored. The order of the least to the most expensive options are:
manually downloading the data from a data logger at the edge of the
field, using Radio Frequency signals to send collected data to one’s own
PC, and, finally, using a cell or satellite modem to transfer
information from the field data logger to a commercial data management
platform on the web.
The cost and expected life of the various equipment components were
provided to the students; then they were split into small groups and the
teams challenged to design a system that would adequately monitor the
soil moisture status of their pivot, while keeping total investment
costs to less than $2,800 and annualized costs less than $10/acre/year
(Fig. 1). Each team then reported back to the whole group on their
design (Fig. 2), explaining why they chose their design and what the
initial and annualized costs were. The other groups could then ask them
questions or comment on their design.
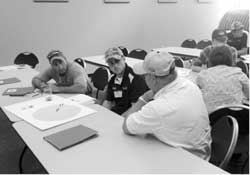
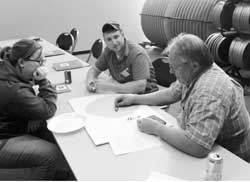
Fig. 1. One of the teams at the workshop discussing
the placement and number of monitoring sites, and if
the total cost would be something a real pivot owner
might be amendable to.

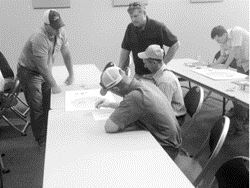
Fig. 2. Tim Reinbott, superintendent of the MU Bradford Farm,
makes the presentation for his team to other session attendees.
The background in irrigation of the students varied from none to
having previously worked with an irrigation company. The groups brought a
lot of common sense to the project, for instance, many opted to having
their pivot design service a shallow clay-pan soil, common in central
Missouri, and so they elected to monitor the moisture in just the top
foot. Field-scouting expertise of some of the team members came to the
forefront by choosing locations in their design that would both be
easily accessible and well-marked. However, most of the groups scattered
their sensor sites around the pivot. Only one group thought to install
their sensor locations so that they would lay in a straight line
radiating from the center of the pivot. Doing so would have it that all
the sensors were watered at the same time. Scattering sensors would mean
that some sensors would have just been wetted, while others a day or
week before. It would be confusing to try and average sensor values that
weren’t watered simultaneously.
Challenging the students to think about and discuss their ideas with
others in their small break-away groups and then coming up with their
own design – it was thought – was a better way to learn about placement
of sensors, data loggers, and economic concerns then by a moderator just
flipping through a few PowerPoint slides on the topic.
Henggeler came up with the idea of using a model from work he had
done with irrigators 40 years before while a Peace Corps Volunteer
(PCV), where he worked as an irrigation extension agent in Sierra Leone
(Fig. 1). PCVs in that west African country were teaching rice growers,
who used the slash-and-burn method on steep hillsides, which entailed
going to a different site and starting over every year (not to mention
the severe environmental problems of erosion), that they could instead
farm, year after year in the same spot if they would cultivate the
swamps that snaked between the hills, once they cleared them and put in
damming and drainage structures. The swamps were only about 100 yards
wide but would meander for miles and miles. Since Sierra Leone gets
almost 100 inches of rain a year, inland paddies could be irrigated with
caught rainfall moving down the swamp. The swamps were naturally lower
in the center, with land surface elevations rising on either side. The
central water way at the head of the field serving both as the supply
ditch and the drainage ditch, was dammed up so that water could be
diverted to the outside edges of the field where it was introduced into
the paddy and then recollected in the drainage ditch.
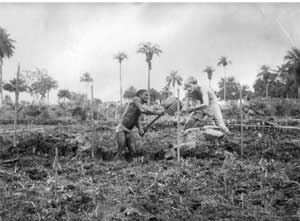
Fig. 3. Joe Henggeler working with one of his farmers on constructing
the central water way in his future rice farm. The head dike that diverts
the swamp’s stream of water to the outside edges of the field is already
constructed and can be seen at the top of the field.
To show farmers how this worked he got a piece of plywood and used
clay to build a scale model of a section of swamp farmland that had
bunds around the paddies and a central waterway. Running water from a
small container at the top of the model, farmers could play with damming
the top and bring water in from the sides to be collected back into the
central drainage ditch. Farmers quickly caught on to what needed to be
done in their swamps. Forty years later, Henggeler could use Google
Earth and see that those systems are still in use today. ∆
DR. JOE HENGGELER: Irrigation Specialist, University of Missouri