Foliar Diseases And Fungicide Applications In Corn
HEATHER MARIE KELLY
JACKSON, TENN.
Trying to decide whether or not to spray fungicide on your corn? First, you should scout for diseases which is one of the key factors when considering a fungicide application.
Major corn diseases are favored by humid conditions, so the edges of fields will not be the place to scout. Within fields, especially low spots that hold moisture are good areas to scout for disease as it may develop in those areas first. Be on the lookout for lesions and use the resources on UTCrops.com and particularly under Corn Diseases in the photo gallery (Corn Diseases in Tennessee) which contains disease images and weather conditions that favor disease development.
One of the most common foliar corn disease in Tennessee is gray leaf spot (caused by a fungus – Cercospora zea-maydis), especially in continuous corn fields (see Images 1 and 2). Other diseases that may be seen include anthracnose leaf blight (caused by a fungus – Colletotrichum graminicola), Northern corn leaf blight (caused by a fungus – Exserohilum turcicum), Southern corn rust (caused by a fungus – Puccinia polysora), and common corn rust (caused by a fungus – Puccinia sorghi). When in doubt don’t hesitate to contact your local county agent for advice on disease management and identification.
Deciding to apply a fungicide to corn should be based upon multiple factors including:
• Disease presence
• Weather conditions
• Cropping history
• Hybrid
Foliar fungicide applications in corn is more likely to provide a response in yield when disease is present or there is significant risk of disease, weather conditions favor disease development, the field is corn after corn, and a disease susceptible hybrid is planted. Research data from University of Tennessee and other universities has continuously found these factors to strongly influence the magnitude and consistency of yield response to a foliar fungicide application in corn.
When factors warrant a fungicide application, the application timing that has provided the most consistent yield response over non-treated corn is a fungicide application at VT or R1 growth stages (tasseling to pollination). Tables below are from the Regional Corn Fungicide Summary data from the Corn Disease Working Group (CDWG), compiled by Dr. Kiersten Wise from Purdue University. The mean yield response of fungicide applications compared to non-treated control from 15 states and Ontario, Canada in 2014 was 2.3 bu/a with applications at growth stage V3-V8, 7.6 bu/a with applications at VT-R2 (tasseling to pollination), and 4.9 bu/a with applications at V5 plus a VT-R1 application (first table). University researchers have compiled such data since 2010 and the yearly data and mean across the past 5 years is shown in the second table below. Keep in mind this is across areas with variable weather conditions, field histories, hybrids, and varying disease pressure. In 2014 yield response was highly influenced by the amount of disease with fungicide applications at VT-R2 which had less than 5% disease (86 observations) mean yield response was 3.0 bu/a compared to non-treated, while applications applied where there was more than 5% disease (121 observations) had a mean yield response of 11.1 bu/a.
The response in yield to break-even on fungicide application can be found in the third table below. Using a wide net of break-even scenarios based on past average corn prices and $12 to $36 application costs the table shows bushels per acre response that would be required to recover the cost of the fungicide application.
Break even scenarios for corn fungicide application
There are multiple fungicides labeled for corn and for the control of different diseases. The multistate collaborative, the Corn Disease Working Group (CDWG), has developed information on fungicide efficacy for control of certain corn diseases. This corn fungicide efficacy table can be found at UTCrops.com (Corn Fungicide Table – CDWG) and below. Application coverage is also important, which includes using sufficient amount of water per acre and adequate droplet size based on the product being applied. ∆
DR. HEATHER MARIE KELLY: Extension Plant Pathologist, University of Tennessee
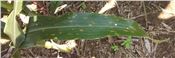
Image 1. Beginning lesions of GLS in lower canopy
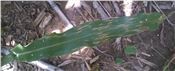
Image 2. Lesions of GLS elongating on corn leaf
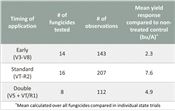
2014 Regional Corn Fungicide Summary
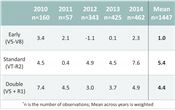
Mean yield response to fungicide compared to non-treated
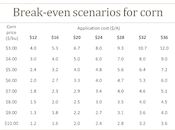
Break even scenarios for corn fungicide application
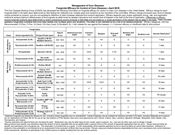
Corn Fungicide Efficacy Table