Notes On Fall Fertilization
DR. EMERSON NAFZIGER
URBANA, ILL.
With harvest winding down in most of Illinois after another year with high to very high yields, it’s time to review some basics of fall fertilization. Neither fertilizer nor grain prices are historically high, so there’s reason to be aware of costs while making sure to cover the nutrient basics.
Nitrogen
In a webinar on October 19 organized by the Illinois Fertilizer & Chemical Association, we looked at some of the nitrogen response data that have come in so far this fall and considered what this might mean in terms of fall N management. In some of the trials, modest N rates produced high yields, much like we’ve been seeing routinely in recent years. But in a few other trials, we found that the crop needed more N than we have seen most recent trials on productive soils. It’s too soon to call this a phenomenon for 2018. Even if this turns out to be more common this year, using previous research results to determine best N rates, which is what the N rate calculator does, means that unusual results get “diluted” by normal results from this and previous years. So adding data from this year will not move the MRTN (best) N rates by very much. We have no way to predict what next year will bring, and so using all of the data from recent years really is the best guess at what N rates we should use for 2019. We really can’t react to unusual responses in any trial in any year by making wholesale changes in how we manage N fertilizer.
The need for high N rates in some in some trials this year may be partly related to high yields, though yields are not much higher in most trials than we had in 2017, when moderate N rates were usually enough. One unusual feature of the 2018 growing season was the cool, wet April followed by unusually warm weather in May. This might have caused a delay in the start of mineralization of soil N, which, coupled with rapid early crop growth. might have meant that more of the N for the 2018 crop needed to be supplied with fertilizer. As more results come in we’ll be able to get a better handle on this, perhaps including some possible ways to improve N management if we see similar developments another year.
Soil temperatures dropped quickly in mid-October this year, and in central and northern by now they are at or a little below the 50 degrees F that we consider to be the maximum soil temperature at which to safely apply anhydrous ammonia fertilizer in the fall. The forecast calls for cool and cloudy weather most of the next week, and it appears likely that soil temperatures will stay below 50 degrees into November. Low temperatures lower microbial activity that converts ammonium to nitrate, which helps keep N mostly in the ammonium form; this is the form we hope to have present as soils freeze up this fall. Soil temperatures (we suggest 4 inches deep under bare soil) can be tracked at the WARM website maintained by the Illinois State Water Survey. Data are available there either as maps of Illinois or as soil temperatures at one of the individual weather-recording sites. Map options include daily maximum, daily minimum, or “average hourly” values, which has a default of 10 AM. I suggest changing 10 AM to 12 PM (noon) on that map; soil temperature at noon is usually a little higher than at 10 AM, so is a little more conservative. Nitrification inhibitors such as nitrapyrin (N-Serve® from Dow/Corteva) and pronitridine (CenturoTM, new from Koch) inhibit microbial activity responsible for conversion of ammonium to nitrate in the soil, and so have the same effect as do cool soil temperatures. Both an inhibitor and waiting for cool soils are suggested as ways to minimize nitrification activity following application of fall-applied ammonia.
If we enter the NH3 price as $525 per ton ($0.32 per pound of N) and the corn price of $3.50 per bushel into the N rate calculator, it calculates MRTN rates of 161 and 178 lb. N per acre for corn that follows soybeans, and 205 and 203 lb. N for corn that follows corn, in northern and central Illinois, respectively. The “profitable range” given by the calculator includes about 15 lb. N on either side of the MRTN. This range is based on our finding that the return to N stays near its maximum over a range of N rates when we combine a lot of N rate trial data. This provides some leeway for those who want to adjust the rates based on experience. But producers and advisers should have a good reason to move N rates above the upper end of the range. We are not seeing this year, nor have we seen in previous good years (like 2017), that high corn yields consistently require higher rates of N than do lower corn yields.
Conditions not conducive to fall N (as ammonia) application to a field include having soils warm or wet, very poorly-drained soils, and light-textured soils through which water moves quickly. The latter two – poorly-drained and light-textured soils – should not have fall-applied ammonia even if they are cool and dry enough, given the potential for loss before crop uptake begins next spring. Higher loss potential due to warmer fall and spring weather also makes it too risky to apply fall ammonia south of the terminal moraine that roughly follows IL Route 16. Applying NH3 to wet soils restricts the spread of NH3 – ammonia moves away from its release point in the soil only until it’s dissolved in soil water, which in wet soils may only be an inch or two. Such a small band means less dispersion in the soil before next spring, which can limit root access to the N. Having the N so concentrated in the band can also increase the chances for NH3 to move up and out of the soil if the soil happens to dry out after application. Ammonia knives should be run deep enough to release NH3 about 6 inches deep on most soils, and perhaps a little deeper on loam soils or dry soils, where we expect NH3 to move farther from where it’s released. The old rule of thumb – if you can smell ammonia during application you need to check its placement – remains useful.
We have compared fall- versus spring-applied ammonia in a variety of experiments over the past five years in Illinois, and have generally found that both produce similar yields at similar N rates. We have found modestly higher yields, in some cases with less N, for spring-applied N, but we have also found, more rarely, fall N producing slightly more yield than spring N. Most measurements of tile-line N loss report loss of a little more nitrate-N from fall-applied compared to spring-applied N. In our soil N studies, we have found that spring-applied NH3 takes several weeks longer to convert from ammonium to nitrate compared to other forms and times of N. So when the spring weather is wet, more nitrate in the soil from fall-applied ammonia can mean more loss of N. In relatively dry springs, water doesn’t move through the soil or stand in parts of the field to cause denitrification, so there is little or no N loss even if all of the N is present as nitrate. If carefully applied, both fall- and spring-applied NH3 are very good sources of N. Wet soils in the spring typically make it more difficult to apply NH3 properly, and without a lot of soil compaction. In general, applying NH3 in the fall as long as conditions are good (soils cool and not wet), then waiting until spring to apply the rest (as NH3 or some other form or combination of forms and times) constitutes sound N management.
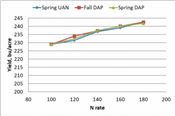
We just completed a three-year study designed to measure how much of the N in the common phosphorus fertilizer diammonium phosphate (DAP, which is 18 percent N and 46 percent P2O5) is available to the corn crop the following year. We did this by applying rates of N ranging from 0 to 80 lb. N per acre, as either fall-applied DAP, spring-applied DAP, or UAN (no P) applied at planting. These rates were in addition to a base rate of 100 lb. N applied as UAN, and we used triple-super-phosphate (TSP) fertilizer (which has no N) to make sure all plots got the same amount of P. The trial was run at both Monmouth and Urbana over the 2016-2018 seasons, for a total of six site-years. We found that the corn crop responded the same to N from all three sources (Figure 1.) While that’s a little surprising given that the N in fall-applied DAP is likely to be nitrate (and so subject to loss) earlier in the spring than spring-applied DAP or UAN, it tells us that we can count all of the N applied as MAP or DAP as part of the total fertilizer N rate we plan to use. One caution: we applied fall DAP in this study between mid-October and early November; applying it earlier in October when soils are warmer will increase the rate of conversion of the N to nitrate, thereby increasing the potential for loss.
It is important to include in the N rate to be applied for next year’s corn crop all of the N we apply – “main” applications in fall or early spring, fall or spring DAP, N applied with the planter, N used as herbicide carrier after planting, N applied as manure, and any sidedressed amounts. We sometimes tend not to count “minor” amounts, but unless we have some way to know that some N was lost, we can’t justify leaving any of the N out of the total we record as the rate we will apply.
P and K
Fall application of the dry fertilizer materials to supply P and K to the next year’s (or next two years’) crops is normal practice, although there has been some moving of P and K applications to the spring. That’s not a problem with timing – even though P and K are relatively immobile in the soil, applying them as surface broadcast well in advance of crop emergence tends to work well. But fall soil conditions are often better for driving application equipment over fields, and many producers don’t want to add fertilizer application to the list of spring tasks. Most P and K fertilizers are broadcast, but some now apply these materials as bands placed into the soil, in some cases beneath where rows will be planted. Research has shown limited if any yield response to banding P and K compared to broadcasting, especially on productive soils with adequate P and K test levels already present. An advantage to placing P into the soil is that it is less prone to running off with rainfall. But this requires special equipment, and application of dry fertilizer in bands is substantially slower and more costly than broadcast application.
While most P and K fertilizer is applied to soybean stubble in preparation for corn the next year and then soybean the year after that, we have seen some claims recently that soybean “needs its own P and K” and that it shouldn’t have to “settle” for the P and K “left over” from the corn crop. In all but very low-testing soils, where crop roots can have trouble reaching enough P and K as they grow into the soil, research has failed to show a benefit to annual applications of P and K, at least in soils such as those in Illinois. We know for certain that it costs more to apply nutrients every year than only once in two years. There have also been claims that soils tie up P and K over time after they are applied, such that “freshly-applied” nutrients are more available to plants. But applying amounts of P and K that crops remove tends to keep soil test levels fairly constant, suggesting that any tieup of P and K is not a permanent “loss” of these nutrients; as long as soil test levels are adequate, both crops get enough even if their roots don’t encounter fertilizer granules as they grow.
A sound approach to determining rates for P and K is to add up the amount removed over the last two years (assuming a biennial application) and to apply that amount in preparation for the next two years. A year ago in a Bulletin article I reported the results from a recent NREC-funded grain nutrient sampling project in Illinois. We set grain removal levels as the values below which 75 percent of sample values fell, so a little higher than the average amounts of nutrients we found in the grain samples. In some 2,100 grain samples of both corn and soybeans, we found removal levels of 0.37 lb. P2O5 and 0.24 lb. K2O per bushel of corn grain, and 0.75 lb. P2O5 and 1.17 lb. K2O per bushel of soybean grain. These are 10 to 15 percent lower than previous “book values” used in Illinois and many other states, and are in line with levels reported within recent years by Iowa State University scientists.
Even with slightly lower P and K removal levels than we have used in the past, high yields mean removal of a lot of nutrients from fields. In a field that produced 240 bushels of corn in 2017 and 75 bushels of soybean in 2018, we calculate that harvested grain over the last two years removed 0.37 x 240 + 0.75 x 75 = 145 lb. P2O5 and 0.28 x 240 + 1.17 x 75 = 155 lb. K2O per acre. At current estimated retail prices of $520 per ton for DAP and $370 per ton for potash, the fertilizer to replace these amounts would cost about $123 per acre, not including the application cost.
The still-used “200-200” application (200 lb. DAP, or 92 lb. P2O5 and 200 lb. potash, or 120 lb. K2O) every other year was enough to keep soil test levels moving up when using such rates was common. That’s because yield levels were much lower than in recent years; Illinois corn and soybean yields from 1961 through 1979 averaged 96 and 31 bushels per acre, respectively. Having applied rates in many fields exceed removal for decades is why soil test levels are as high as they are in such fields today. But using that amount of fertilizer at today’s yield levels will mean a steady drop in soil test values as more nutrients are removed than are replaced.
Low crop prices often have some people wondering if they might cut back some on P and K in order to save money, presumably until crop prices are higher (or fertilizer prices are lower) in a year or two. Despite imaginative claims of “hidden hunger” and some overwrought interpretations of tissue testing levels, P and K deficiency symptoms are very rare in Illinois; we tend to see such symptoms when soils dry out after planting and roots have trouble growing into soils enough to take up adequate P and K, even when soil test levels are high. Such symptoms are more common in compacted soils and in no-till fields, but we hardly ever see such symptoms with spring rainfall is normal.
With adequate soil test levels of P and K in most fields and with crops that are good at extracting these nutrients, delaying the application of some or even all of the P or K for a year or even two years is likely to have little or no effect on the yield of the next crop(s). Still, nutrients removed by the most recent crops do need to be replaced, if not before the next crop or two then after that; higher soil test levels now provide more leeway. The real risk comes from allowing removal to exceed replacement over years, to the point where even good root systems can’t take up enough nutrients, and yields suffer. Reaching that point in most Illinois fields would take more than a year or two, but Illinois soils cannot generate enough P and K to meet the needs of high-yielding crops, so getting to that point is inevitable if the neglect continues. We can “kick the can” of nutrient replacement “down the road” for now, but that will mean having to replace ever-growing amounts of nutrients later, as grain, along with its nutrients, continues to come off the field every year. ∆
DR. EMERSON NAFZIGER: Research Education Center Coordinator, Professor, University of Illinois