|
Missouri’s Woodruff Irrigation Charts: Still Making Missouri Irrigators Money After All These Years
DR. JOE HENGGELER
PORTAGEVILLE, MO.
Dr. C.M. “Woody” Woodruff developed a graphical chart method for scheduling irrigation in the late 1960s, which later in the ‘70s he developed into a University of Missouri (MU) factsheet. Even though Dr. Woodruff passed away over ten years ago, his innovative concept is still making money for Missouri irrigators today. The original chart (Fig. 1) was specifically designed for corn planted around May 1 in mid-Missouri.
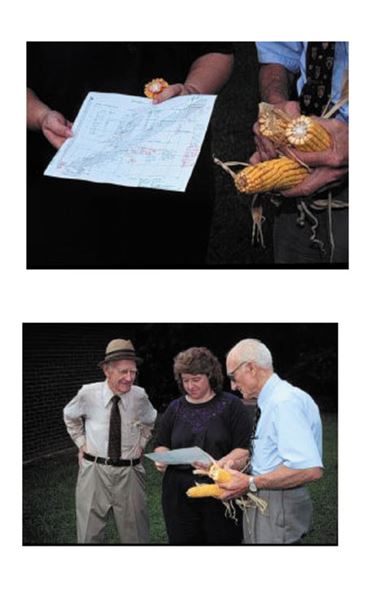
Top Photo: Fig. 1. Woodruff irrigation chart. Not only is rain and irrigation data recorded, but other important field information is noted down on the chart.
Bottom Photo: Fig. 2. Dr. Woodruff (left), MU Regional Specialist Mary Sobba, and farmer, the late Bob Guthrie, look over a Woodruff chart from the previous year.
This chart method of scheduling developed a very strong user base among mid-Missouri irrigators. Later, when new factsheets became difficult to obtain1, producers simply Xeroxed off old, blank factsheets allowing them to continue using the Woodruff method. One additional discovered benefit of the chart method was that besides the rainfall and irrigation data needed for the scheduling being charted down, growers started recording other pertinent field information like herbicide applications, insurance adjuster visists, etc., thus having a thumbnail Agronomic record of that field.
After Dr. Joe Henggeler was appointed state extension irrigation engineer in 1997 with MU’s Commercial Agricultural Program, he and Dr. Woodruff visited local mid-Missouri growers. Henggeler was amazed that this group of irrigators who, had received little state or federal training or encouragement during the last 20 years since Dr. Woodruff had retired, still avidly scheduled irrigation using these charts.
Henggeler, formerly skeptical about using of charts for the purpose of irrigation scheduling, now became a staunch supporter of this method. Since historically, regional efforts at promoting scheduling using things like gypsum blocks / tensiometers or computer programs stayed in place only for as long as the incentives or the free technicians were provided. Once these “carrots” were removed, the projects seemed to disintegrate.
Witnessing the strong user buy-in to this method of scheduling was all it took to convince him that the method was self-sustaining,2 and, should an electronic version be built, would get ample use. Afterwards, he and MU’s AgEBB staff developed the web-based version of the Woodruff method that is used today. This program was installed on the AgEBB server in 2001. Now, nearly ½ million irrigated acres later, the method continues to make money for Missouri farmers who corn, soybeans, or cotton.
Performance of the Woodruff Method
Evaluation on the performance of WWW Woodruff Irrigation charts as a scheduling tool has been carried out both by farmers’ surveys and by replicated trials.
Bootheel Irrigation Survey (BIS)
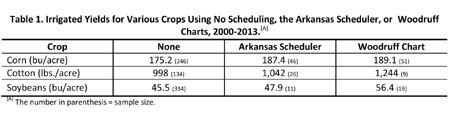
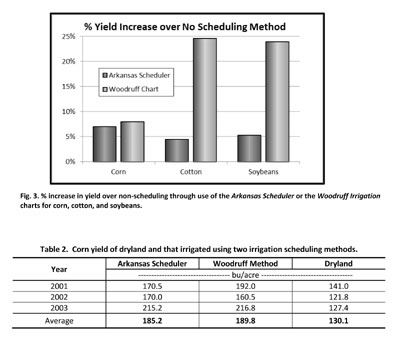
Since 2000 nearly 900 responses to the BIS were collected from farmers in the SEMO region regarding their method of irrigation scheduling. Table 1 lists the yields for corn, cotton, and soybean (with sample size in parentheses) based on the irrigator either not using any method of scheduling, or scheduling with the University of Arkansas’ Arkansas Scheduler, or the WWW Woodruff Irrigation charts. Both scheduling methods out-yielded non-scheduling for all three crops. However, the Woodruff method produced the highest yield for all three crops. Figure 3 shows the % yield increase both scheduling methods had over non-scheduled farms; the Woodruff method had approximately 25% more yield over cotton and soybean non-schedulers.
Replicated Study
A 3-year (2001-2003) replicated study comparing dryland plots versus plots irrigated using the Arkansas Scheduler and the WWW Woodruff method was done at the MU Bradford farm under the supervision of station superintendent, Mr. Tim Reinbott. Table 2 shows yield results. Again, the Woodruff method performed the best.
Current Use
Since 2001 when the WWW Woodruff Irrigation chart site first went online, there have been 3,806 fields scheduled using it resulting in 435,843 acres being irrigated employing a scientific, proven scheduling method. Remarkably, its use is not just found in the Bootheel counties where the majority (80%) of the irrigation in the state is located. The use of the site reaches statewide with nearly 90% of the Missouri counties having made use of the site at some point (fig. 4). The number of acres this represents over time is seen in figure 5.
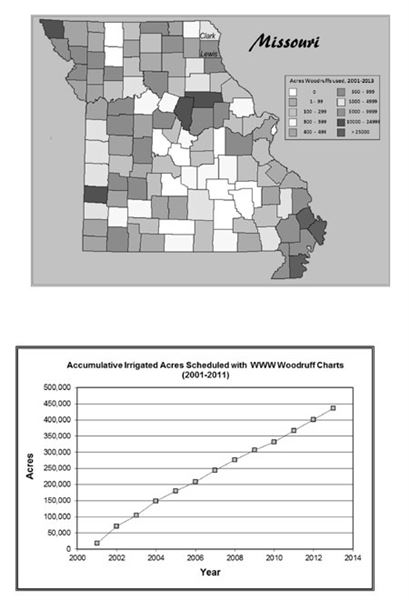
Top Chart: Fig.4. Missouri’s counties with the number of acres that have used the WWW Woodruff site for irrigation, 2001 to 2013. Only twelve out of the total of 114 counties in the state have not employed the irrigation scheduling service.
Bottom Chart: Fig.5. Amount of acres where irrigation scheduling occurred using the WWW Woodruff Irrigation charts.
Economic Impact
The marginal economic impact stemming from WWW Woodruff Irrigation chart use is determined using its documented yield advantage for each crop (table 1), the documented, logged-in, user-provided acreage amounts, and the historic, annual commodity price for each crop (table 3).
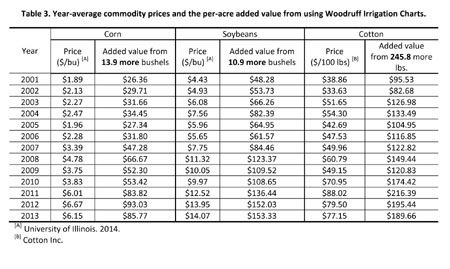
Table 3 list commodity prices since 2001 for corn, soybeans, and cotton. It also lists the per-acre marginal profit (annual commodity value X the average per-acre yield enhancement [2000-2013] generated by use of the Woodruff method). This product is then the per acre marginal profit from using the Woodruff scheduling method for that year, that commodity. Figure 6 shows the accumulative marginal economic profit for all three crops since 2001.
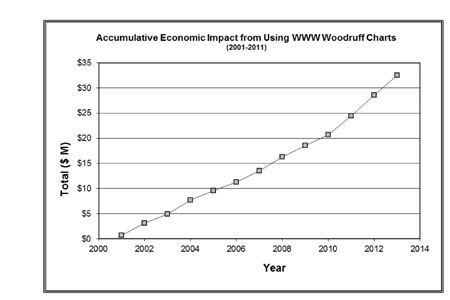
Fig.6. Marginal profits since 2001 enjoyed by Missouri irrigators from the use of WWW Woodruff Irrigation charts.
The 13-year average for increased gross yields is remarkable! It is $51/acre, $96/acre, and $140/acre for corn, soybean, and cotton, respectively! Since the average holdings for the SEMO irrigator is 917 irrigated acres, this would translate to between $50,000 to $125,000 added gross farm income!
Sustaining Economic Impact
Based on current levels of usage of the website and the average commodity prices over the last 13 years (2001-2013) the WWW Woodruff site today provides $ 2½ M added annual gross profits to Missouri farmers. If the average commodity price for the last three years was used instead, then the added gross profit from the website would be $ 4 M annually. This would make Dr. Woodruff very pleased!
Impact Outside of Missouri
The Irrigation in the Pacific Northwest group (an irrigation education consortium comprised of Washington State University Extension, Oregon State University Extension, and University of Idaho Extension), led by world irrigation scheduling authority, Dr. Marshall English, describes the WWW Woodruff site as:
This website contains great tools that are based on historical average ET. The charts need to be custom created for a particular location and crop using historical average ET, but once that is done copies of the same chart can be used over and over again year after year. This is an intuitive way to monitor irrigations and can give “ballpark” estimates of when and how much to irrigate They plan to make such charts available for the Pacific Northwest states soon.
Irrigation engineers in Canada have also shown interest in this method. A little closer to home, the relatively large acreage (11,000 acres) in Clark and Lewis Counties in the northeast corner of the state probably reflect the significant amount of irrigation that is being done in Mason and Tazewell Counties in Illinois. MU has assisted those regions providing guest speakers on irrigation. Additionally, farmers from east of the River often attend irrigation meeting at the T.E. Fisher Delta Center in Portageville, MO.
Dr. Woodruff was a MU icon, and although Dr. Woody passed away in 2003 he would be tickled knowing that the innovative method he developed for timing irrigations still makes millions of dollars each year for his beloved Missouri farmers.
Woodruff Irrigation charts can be obtained for free. One merely inputs crop (including Relative Maturity or Maturity Group for corn and soybeans, respectively), emergence date, and soil type. One also chooses closest Missouri county (which contains the 30-year average historic weather files for that county). To start scheduling the Woodruff go to: http://agebb.missouri.edu/irrigate/woodruff/
For additional help contact Dr. Joe Henggeler at: henggelerj@missouri.edu.∆
DR. JOE HENGGELER: Irrigation Specialist Commercial Agricultural Program, University of Missouri Delta Center
1 The factsheet had a graph that was penciled in when rain or irrigation occurred, making the factsheet useable for just a single season.
2 One of the only other such scheduling efforts to have high local buy-in is the WISP Program (Wisconsin Irrigation Scheduling Program).
|
|