|
Irrigation Bump
DR. JOE HENGGELER
PORTAGEVILLE, MO.
Irrigation bump (IB) is an irrigation concept that involves two important concepts. First, the definition of IB: it is that extra amount of crop yield afforded from irrigation. Basically, by subtracting your dryland yield from your irrigated yield you arrive at the value of your IB. Since we are wanting to make the comparison solely on the virtue of irrigation, both fields need to have basically been treated with the same level of management other than irrigation (e.g., same variety, similar planting dates, etc.). However, certain management items, such as the apropos fertilizer rates matching dryland or irrigated cultivation requirements are expected to occur and are OK.
Irrigation Bump as an Economic Concept
Your IB with its extra generated profit needs to be able to pay all irrigation bills, both fixed and annual – this is the first connotation for IB. Back in the ‘70s when Missouri was first starting to experiment with irrigation on a larger scale, the question everybody had in the back of their minds then was: in a region with 40-50 inches of rain annually, would irrigation, year in and year out, be profitable? To answer this question, in 1978 (or possibly earlier), the late University of Missouri (MU) regional specialist & Mo. irrigation giant, Dale Schnarre of Audrain County, started a farmers’ survey on the results of irrigation for central and northern Missouri. At this time, central Missouri, not the Bootheel, was the hub of irrigation activity in the state. Their annual irrigation conference lasted three days!
Although they collected information on some of the other extraneous irrigation practices being done (e.g., is the field watered from a well or a pond, etc.), the prime purpose of the survey was to answer the important E-question, was irrigation economical? MU’s, Dr. Ray Massey, an agricultural economist from Columbia, got involved in doing the economic analysis, and published the results in popular agricultural publications. Even before coming to Mo. in 1997, I remember reading about the results of the Schnarre-Massey irrigation survey in agricultural magazines back in west Texas.
In 1987 data from irrigation results in the Mo. Bootheel in southeast Missouri (SEMO) also began to be collected and compiled, this time by Dr. Van Ayers (currently a MU Extension Community Development Specialist in Stoddard County). I assumed this responsibility of conducting and compiling the survey, now called the Bootheel Irrigation Survey (BIS) when I arrived in 1997. A summary of survey results can be found at: http://agebb.missouri.edu/irrigate/survey/bhsummary.htm.
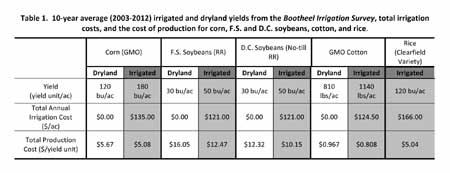
As previously discussed, IB is a farmer’s irrigated yield minus his dryland yield. The 10-year average of both of these yield levels for corn, full season and double-crop soybeans, and cotton (gathered from the BIS) are shown in Table 1. For example, the corn average irrigated yield over the last 10 years is 180 bu/acre, while the dryland yield is 120 bu/acre, making the region’s IB to be 60 bu/acre (180 – 120).
The table also shows the total annual cost for all related irrigation outlays (both fixed and variable) taken from MU’s David Reinbott’s excellent website on irrigation economics for SEMO (available at: http://extension.missouri.edu/scott/crop-budgets.aspx).
Total irrigation costs for the major SEMO crops range from a low of $121/acre (for both F.S. and D.C. soybeans) to a high of $166/acre for rice. Note that irrigation costs for corn are $135/acre. This means our region’s corn IB of 60 bu/acre needs to be worth more than $135/acre, or momma and the banker won’t be happy. The Corn & Soybean blog reported in July: USDA is now projecting 2014-15 yearly average corn prices in a range of $3.65-4.35 per bushel, or an average of $4 per bushel.
Using the $4 figure, our region’s corn IB is worth $240/ac, so the banker can be happy and momma can get a new spring hat.
Table 1 shows average irrigated and dryland yields plus the total (fixed + variable) costs involving irrigation for some of our major crops. The table also shows the cost of production (cp) for both dryland and irrigated cultures for those same crops. Notice that in all cases, the cp of the irrigated is lower than the dryland’s cp, meaning irrigation is more profitable.
Irrigation Bump as a Report Card on Your Irrigation Skills
IB can also be used as a peephole to examine the level of one’s irrigation skills. It is naturally expected that a farmer, whose dad or granddad never used irrigation, and is now himself is just getting into using irrigation has to hike up a somewhat steep learning curve. In the novice’s first year or two – during which his irrigated yield, although, it will most likely outshine his dryland yield, is not the irrigation home run he was hoping for. In short, the yield difference between the irrigated and the dryland may be small. As mentioned earlier, SEMO’s corn IB for the last 10 years of the survey was 60 bu/acre, whereas for the first 10 years of the survey, starting nearly 20 years before, the IB was only 45 bu/acre.
By comparing a person’s (or a region’s) change in IB between two time periods, one can determine if the irrigation skill level has increased and by how much so. As an example, let’s compare the periods before and after MU developed its irrigation specialist position in the Bootheel back in 1997. The two periods would be 1987–1997 and 1998–2012. Figure 1 shows the percent increase in IB following the creation of the MU irrigation position for corn, full-season and double-crop soybeans, and cotton. All four crops show improved IB, which means that irrigators have improved their irrigation knowhow relative to their dryland knowhow. Remember that both the irrigated and dryland yield data come from the same famer who happens to have both irrigation and dryland on his farm.
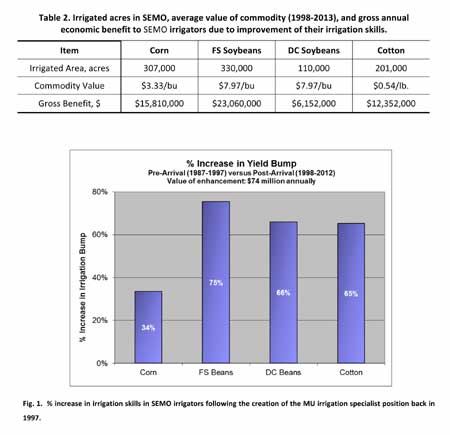
Corn has the lowest increase in IB at 34 percent. This may reflect the fact that irrigation of corn, often grown on sandy soils, began to occur earlier in SEMO. The other crops show IB increases ranging from 65 to 75 percent. Table 2 shows, for all four crops, the irrigated acreage in SEMO, average commodity value for the time period 1998-2013, and gross economic benefit to SEMO irrigators derived from having improved their irrigation knowhow. The combined economic benefit from all four crops derived from being more astute irrigators is $57,400,000 annually!
One might think these results in Missouri are just a fluke due to weather or some other outlying factor. How do you verify that they are real? You can do this by comparing Missouri’s results to the results seen in other states. If the increase in IB between the two periods is not seen in datasets from other states, then the claim that this phenomenon is based on something that has happened in Missouri alone stands.
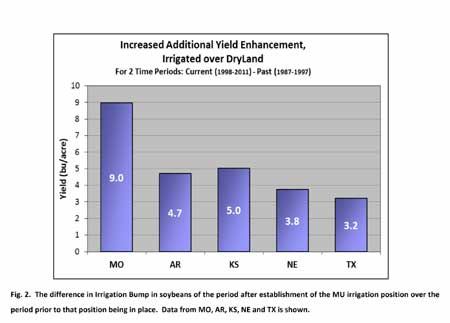
So, we will compare the same data for all other states with FSA-published yields on both irrigated and dryland soybeans (i.e., AR, KS, NE and TX). Again, the pre-position period is 1987 to 1997; the post-position period is 1998-2011. We will use soybeans.
For Missouri the IB difference between pre- and post-establishment periods is 9.0 bushels/acre of soybeans. The increase in IB for the other states for the same periods of time is 4.7, 5.0, 3.8, and 3.2 bushels/acre for AR, KS, NE and TX, respectively (fig. 2). This makes Missouri’s growth rate in IB to be 0.70 bushels/acre/year since the establishment of the 1997 irrigation position. The corresponding average IB growth rate for the four other states is only 0.36 bushels per acre per year for that same time period. In effect, the skills of Missouri irrigators have increased at a rate twice that of irrigators of other states.
Note that the IB in all five states is increasing, it is just that Missouri was doing so more rapidly. Assuming 440,000 acres of irrigated soybeans in the Bootheel and using the annual reported soybean prices the fact that Mo.’s IB growth rate was at the accelerated 0.70 rate and not at the 0.36 bushels/acre/year rate experienced by the other states represents a gross annual difference of ≈ $7 million since 1998. Thus the approximately $29 million benefit for both types of beans shown in table 1 would instead have been $22M (29M – 7M) if Mo. irrigation skill levels had been in the order found in other states.
Conclusions
Irrigation bump is an import concept in irrigation. It both represents the economic goalpost separating being in the black from being in the red. It also is a report card and an excellent tool in discerning irrigation skill levels. Comparing IB levels between two time periods reflects what increases in irrigation savvy are occurring. It can also be used to compare two groups of people, regions, states, etc.
Missouri irrigators have undoubtedly improved over the last 15 years are so. The most likely reason was that MU had the insight to establish an irrigation position back then. Missouri irrigators are today earning $57 million dollars more each year because of this. Other states in the mid-South are beefing up there irrigation expertise. LSU has just hired four irrigation types; the irrigation expertise in the whole mid-South has never been so strong. Hopefully, MU will never phase out its one, sole irrigation position! ∆
DR. JOE HENGGELER: Irrigation Specialist, University of Missouri
|
|