|
Is Fall-Applied Nitrogen Still Present?
DR. EMERSON NAFZIGER
URBANA, ILL.
The pattern of warmer and wetter than usual weather this past winter has changed some in the past two months, but hopes for a warm, dry, early spring have faded as well. Concerns remain about how much fall-applied N might have been lost and about whether and how this should change how we manage N this spring.
Most Illinois producers waited until soil temperatures had dropped to 50 degrees or less before applying anhydrous ammonia last fall. Soil temperatures dropped a little slower than normal during November, though, and in a mid-December warm period, soil temperatures approached or exceeded 50 degrees for a few days in much of central and northern Illinois. December rainfall was well above normal, with about 4 inches falling over most of the state right after Christmas. January brought lower temperatures, but tile lines continued to run much of the winter, and above-normal temperatures returned in February and March.
Dan Schaefer of the Illinois Fertilizer and Chemical Association and we in our Nutrient Research & Education Council-funded N tracking research project have been doing some soil sampling this past winter and early spring to see if we can measure how much of the N applied as fertilizer last fall might be gone as a result of the winter conditions. By “gone” I mean no longer found in the top two feet of soil, which is the depth to which we typically sample.
A set of eight fields in Vermilion County that Dan sampled in December, January, and February showed little change in soil N between December and February, though there was some loss of nitrate-N (NO3–) between the January and February samples (Figure 1.) The percentage of recovered N that was in the ammonium form (NH4+) – the form that’s safe from immediate loss due to its binding with negative charges in the soil – actually went up some, which is explained by the loss of nitrate. Samples like these show a fair amount of variability so we can’t make strong statements, but we can’t conclude based on these numbers that a lot of N was lost over the winter.
Samples that we took after November application (of 200 lb of N), in January at Urbana, and in late February at the Urbana and Monmouth research sites showed a considerable drop in soil N at the late February sampling time (Figure 2.) Samples taken after application showed that most of N that was applied was present in the November and (at Urbana) early January sample times, and that some three-quarters of the N was present as ammonium. By late February, however, the amount of N recovered (after subtracting the N recovered from zero-N plots) was about one-third lower than the amount recovered earlier at Monmouth and less than half the amount recovered earlier at Urbana. At neither location did using N-Serve affect the amount of N recovered nor the percentage of recovered N that was in the ammonium form.
In a set of fields that Dan Schaefer sampled in Champaign County in early January and again in mid-March, total N recovered did not change much, but only 40 percent of the N was present as ammonium in March, down from 60 percent in January (Figure 3.) The fact that some of the ammonium converted to nitrate over this period means that more of the N is now susceptible to loss; the good news is that it is still present in the top two feet of soil.
The field included in the averages in Figure 3 that did not receive N-Serve was paired with one that did, allowing us to see if N-Serve affected the amount or form of N recovered. Averaged over the two fields, about the same amount of N was recovered in March as was recovered in January. But in January, the field with N-Serve had 70 percent of its recovered N as ammonium, compared to 53 percent ammonium in the N recovered from the field without N-Serve. At the mid-March sampling, the field with N-Serve had 73 percent of the recovered N as ammonium, while only 39 percent of the N in the field without N-Serve was in the ammonium form. We need to be cautious because this is from only a few samples, but if these reflect reality then the nitrapyrin did here exactly what it was supposed to do: keep ammonium from converting to nitrate to reduce the amount of N subject to loss. Whether or not that will make a difference in how much N is available to the corn crop depends entirely on what sort of weather, soil, and crop conditions we have up to the time N uptake starts.
We see in the above that sampling soil for recoverable N this past winter gave a mixture of results, ranging from disappearance of more than half of the N from the top two feet of soil to only small changes over time. Adding to the picture is the report that surface waters in some places have reported nitrate levels somewhat higher than normal for this time of year; we would expect this to be coming from tile lines, but some of it could be from N left over at the end of the 2015 season. The percentages of soil N present as ammonium seem to be on the low side of expectations, which could mean considerable potential for loss if the weather is wetter than normal in April and May.
We have little previous experience looking at soil N from fall to spring, so there’s no reason to panic at this point, or to order more fertilizer N to replace what might have disappeared. Our best strategy now is to assume that most of the N we applied last fall is still in the soil, to get the crop planted as conditions allow, and to both monitor the crop and to stay tuned as we continue to monitor soil N up to the time that the crop is taking up N rapidly. The warm and dry spring we hoped for could still materialize, and with it would come low N-loss conditions as well as early uptake of N by a rapidly-developing crop. If the opposite happens, we will still have time to manage N for good yields while minimizing further loss. ∆
DR. EMERSON NAFZIGER: Research Education Center Coordinator, Professor, University of Illinois
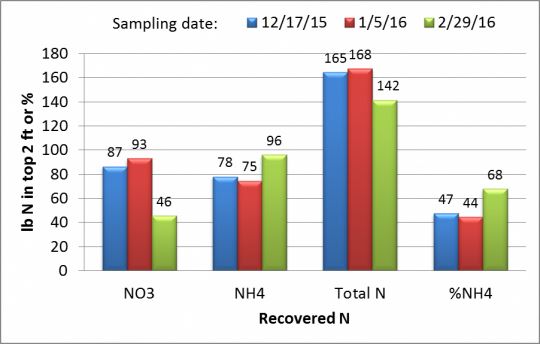
Figure 1. Nitrogen recovered from the top two feet of soil sampled in December,
January, and February, averaged over eight fields in Vermilion County, Illinois.
These fields received an average of 163 lb of N as NH3 applied with N-Serve the second week of November 2015.
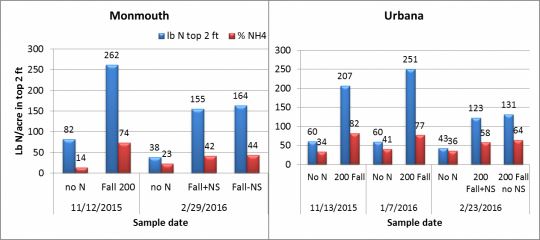
Figure 2. Soil N recovery from N-tracking sites at Urbana and Monmouth, Illinois.
Nitrogen was applied as NH3 at 200 lb N/acre in November at the first sample date.
The late February samples were from treatments with and without N-Serve.
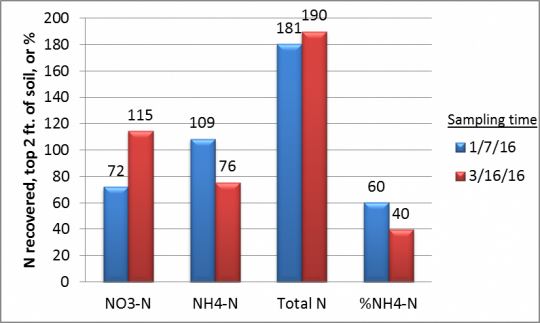
Figure 3. Soil N recovered averaged over eight Champaign County fields where about
180 lb of N as NH3 was applied in the second week of November, 2015. Seven of the fields had N-Serve applied with the NH3.
|
|