|
Playing The Numbers With Bulls Can Make Your Head Spin But Can Help Distinguish Your Cattle From Average Cattle
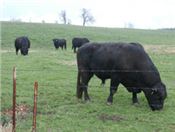
EPDs and bulls
Photo credit: MU Extension
MT. VERNON, MO.
The Southwest Missouri Beef Cattle Improvement Association’s Performance Tested Bull Sale is held twice a year and dates back to 1973.
“There are buyers who have bought bulls at the sales year after year and probably never thought how they could use the EPDs and percentile rank to study their cows,” said Eldon Cole, livestock specialist, University of Missouri Extension.
Cole says that on several occasions he has tracked the regular buyers in an attempt to learn their bull buying habits regarding price, breed, and performance.
“I find that since these buyers save heifers, their bull purchases in the last ten years should provide an indication of the current herd’s genetic makeup,” said Cole.
According to Cole, when a producer has a question about the type of bull to buy they should ask: “What are the strengths and weaknesses of my herd and where do I want to go with my cattle in the future?”
Cole usually says the response is, “I’ve been buying Angus bulls from Joe Jones over at XYZ. I would like to keep selling my calves right off the cow.”
However, that type of buying method doesn’t help much. Instead, Cole says he has done the math with bulls and buyers at tested bull sales. He has gathered expected progeny difference (EPD) data on the bulls bought in the last ten years.
“We started recording EPD percentile rank in 1997 for these EPDs; calving ease, weaning weight, yearling weight, milk, and marbling/intramuscular fat,” said Cole.
Cole has played with the numbers, looking at percentile ranks from the sale catalogs along with the price paid for the bulls.
“The buyers selected save replacement heifers so their purchases should reflect the general genetic makeup of their herd. I realize some of the bulls sire more replacements than others and some may never produce a calf,” said Cole. “This math reflects the kind of seed the producer has planted. Another concern is the EPDs at the sale will change on these young bulls with low accuracies. I contend that even with these concerns, using this routine gives the cow herd owner a better idea of the trend in their herd than just looking at them phenotypically.”
Here is a sample of bull purchases from three different buyers. These are all Angus purchased from 2005 to 2015. These numbers indicate the average percentile rank of the bulls they bought.
Number of bulls: 13; average price: $3,169; Calving Ease 23; Wean Weight 30; Yearling Weight, 29; Milk 27, Marbling 52 and $Wean 26.
Number of bulls: 13; average price: $4,788; Calving Ease 32; Wean Weight 18; Yearling Weight, 17; Milk 40, Marbling 39 and $Wean 28.
Number of bulls: 17; average price: $2,991; Calving Ease 42; Wean Weight 20; Yearling Weight, 19; Milk 35, Marbling 50 and $Wean 38.
To supplement this type of analysis owners should gather their own weaning weights and retrieve post-weaning data, including carcass grades.
To go to the next step, Cole says to consider getting genomic data.
“These numbers may make your head spin, but it helps distinguish your cattle from all those average cattle. In the future, you will be competing with others for sale prices whether you sell feeder calves, finished cattle or breeding stock,” said Cole. ∆
|
|