|
Increased Insect Densities Reflected In Annual Corn And Soybean Survey
KELLY ESTES
URBANA, ILL.
Thirty-six counties representing the nine crop reporting districts were surveyed at the end of July/beginning of August as part of our annual statewide corn and soybean survey. The surveys were performed by sampling five corn and five soybean fields per county. For the past several years (2011, 2013–2017), surveys in corn and soybean fields have been conducted with the goal of estimating densities of common insect pests. The estimates provided in this article should not be considered a substitute for scouting individual fields and making informed pest management decisions—even areas of the state that appear to be at low risk could have contained fields with high densities of a given insect pest.
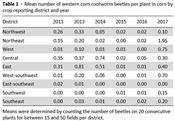
Western corn rootworm beetles were sampled in cornfields by counting the number of beetles on 20 consecutive plants beyond the end rows of a given field – a beetle per plant average was calculated for each field. A mild winter followed by favorable conditions at egg hatch and adult emergence helped the small populations from 2016 gain some traction in 2017 (Table 1). Per plant averages are up compared to recent years, though looking at the big picture, these numbers are still considered low. The district average from the northeast (1.95 beetles per plant), was affected by a single field in LaSalle county that average 7 beetles per plant which leads to a very important point to consider with this survey. Fields are randomly selected. We have no knowledge of insect management strategies that are used – soil insecticides, transgenics, or foliar applications.
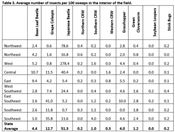
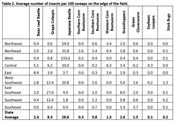
Within an adjacent soybean field, 50 or 100 sweeps were performed on both the exterior of the field (outer 2 rows) and interior (at least 12 rows beyond the field edge) using a 38-cm diameter sweep net. The insects collected in sweep samples were identified and counted to provide an estimate of the number of insects per 100 sweeps (Tables 2 and 3).
The number of western corn rootworm adults in soybean fields throughout the state was low as well. The greatest number of beetles in soybeans occurred in McLean County, 8.00 beetles per 100 sweeps. All other counties sampled had fewer than 5 beetles per 100 sweeps (range of 0 to 2.4 per 100 sweeps).
Japanese beetles continued to increase in number from 2016 in the western part of Illinois. Both Fulton and McDonough counties recorded over 200 beetles per 100 sweeps in several fields, with their county averages of 525 and 340 beetles per 100 interior sweeps, respectively. Undoubtedly some of the highest numbers I’ve seen in this survey.
Overall, grape colaspis numbers were higher in several districts. This follows earlier reports during the growing season of grape colaspis feeding in soybeans. Unfortunately, there is no direct correlation between grape colaspis presence in soybeans and potential for larval injury in corn the following year. Numbers continue to be variable for this insect, but were high in the east southeast counties and should bear watching in 2018.
Stink bug injury in soybeans continues to make news in the southern states. We saw little damage caused by stink bugs in this survey, though numbers were slightly higher than past years. We continue to monitor for potential spread of not only the southern species like red banded and redshouldered stink bugs, but also the spread of brown marmorated stink bug as it gets its foothold here in Illinois.
Funding for survey activities was provided by the USDA National Institute of Food and Agriculture. This survey would not be possible without the hard work and contributions of many people. I would like to thank Illinois Cooperative Agriculture Pest Survey Program interns Evan Cropek, Ryan Pavolka, Emma Sementi, Jacob Styan and Hannah Hires as well as Department of Crop Science interns Lacie Butler, Kaela Miller, and Matt Mote. ∆
KELLY ESTES: Agricultural Pest Survey Coordinator, University of Illinois
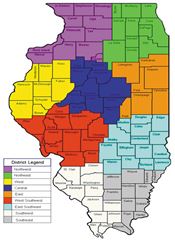
Figure 1. Illinois crop reporting districts surveyed during 2017
annual corn and soybean insect survey.
|
|