|
Illinois Professor Takes Another Look At Soybean Planting Date
DR. EMERSON NAFZIGER
URBANA, ILL.
As we wait for things to dry out so planting can begin in Illinois, I’ll provide an update on soybean planting date, including addition of some recent data and more detail on what planting date studies are telling us.
Between 2010 and 2018, we ran a total of 30 soybean planting date trials at four sites – Urbana and Perry in central Illinois and DeKalb and Monmouth in northern Illinois. We also ran trial at two southern Illinois sites in some of those years, but wet springs in many cases limited the data amount or quality – poor stands from heavy rainfall makes a mess of planting date response – and we generally found there that planting date responses are similar to those in central Illinois.
Most trials included four planting dates, with target date ranges of April 15-20, May 5-10, May 20-25, and June 5-10. When planting couldn’t be done within the target range, later plantings were adjusted; the last planting was later than June 10 in about one-third of the trials. Each trial had four replications, with plots consisted of four 30-inch rows (or seven 15-inch rows) by 25 to 50 ft. long, depending on the location. Two 30” or four 15” rows were harvested with a small plot combine.
We dropped the data from the trials at Perry (Orr Center) in both 2011 and 2012, leaving 28 trials with usable data. In 2011 at this site, yields were low and the last date was very late (June 22), while in the drought of 2012, yield increased with later planting, from only 15 bushels when planted on April 15, to 31 bushels when planted on May 25. That happened because rain that fell beginning in late July was too late for early-planted soybeans, but was of some help to later-planted ones. While we can’t rule out the possibility that this could happen again, including “outlying” data from those two trials had a very large effect on response over all trials, and that lowers the ability of the data to predict planting date response.
We converted the yield data into percent of maximum yield in each trial, then did a regression of yield against the number of days after April 1 and this number squared, producing a curve that shows acceleration of yield loss as planting date gets later (Figure 1.) Yield loss from planting delays is a little less than I reported previously: according to the curve, planting on May 1, May 15, May 30, and June 10 produced yield losses of 2, 7, 12, and 18 percent, respectively. At the maximum yield average of 71 bushels per acre, planting on these dates meant yield losses of 2, 4, 9, and 13 bushels per acre, respectively. That’s still a loss, at least at dates later than May 1, but under normal conditions, we can generally plant into mid-May without losing a lot of yield.
Although fitting a line to the data like we see in Figure 1 shows a small loss in yield for planting on May 1, this line is forced down by the effect of later planting; only once in 25 plantings made before May 1 was yield (at 96 percent) less than 98 percent of maximum. This shows that there is little danger of yield loss in soybeans from planting too early, although we didn’t plant in February or March like some have in order to see how yields respond to such “punishment.” This also shows that there’s no real yield penalty from planting in late April or the first few days of May, compared to planting earlier in April.
Planting date studies are not easy to do, and the data from them are somewhat tricky to summarize. Although in this case the data line up relatively well across planting dates, Figure 1 shows that there’s a considerable amount of variability in yield response to planting date, especially at the later dates. As an example, yields from planting between June 1 and June 10 averaged about 85 percent of maximum, but ranged from 74 to 100 percent of maximum.
Another way of looking at data like this is to cluster it into groups based on planting date ranges, then to see if the variability is large enough to prevent us from having confidence that that planting date within that range had any effect on yield at all. To do this, I broke the data into 10-day planting windows, and ran “descriptive statistics” (using the Excel® spreadsheet) on each group of data to see if variability meant loss of certainty (Figure 2.)
The small I-shapes atop the data bars show the “95 percent confidence interval”, which is a statistical calculation based on variability among the numbers. Here, if this interval includes 100 percent (which it does for the first two clusters, April 12-20 and April 21-30), then we can’t say with confidence that the average yield from planting dates in that range is less than 100 percent. As planting gets later, there’s more variability and so larger confidence intervals, but none of them overlap the 100 percent line. This means that once we pass May 1, the loss in yield is real, and not almost certainly not due to random chance because of high variability.
What’s the point of such an exercise in statistics? In this case, we can see that the line in Figure 1 fits the data points fairly well, but there were still some relatively high yields even with early June plantings. This analysis shows that enough of the data points were low enough that we can’t reasonably expect planting on June 1 to yield as much as planting on May 1, even though that can happen once in a while.
This also illustrates the need for more than one or two studies to give us reasonable confidence that our data predict future responses, which is the whole point of doing such work. Like other factors whose effects depend on weather, planting date studies are notorious for producing widely varying results. So if we had data from only three or four trials, the confidence intervals, which increase in size as the number of points decreases, would likely be so wide that we’d have little idea what to expect when planting late. Or data from only some trials might be selected to make responses look uniform. That creates confidence – “this is what we always see” – but selecting data we “like” is just making up the story. That story might be a nice one, but it’s not one that will help us to know what to expect the next time we head to the field. ∆
DR. EMERSON NAFZIGER: Research Education Center Coordinator, Professor, University of Illinois
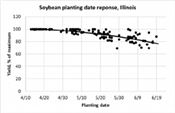
Figure 1. Soybean yield response to planting date over 28 Illinois trials.
Data are from four sites, 2010 to 2018.
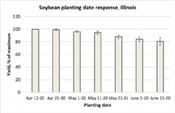
Figure 2. Planting date responses clustered into seven, 10-day planting periods corresponding to
the segments separated by vertical lines in Figure. The I-shaped bars atop the data bars show
the 95% confidence interval for that cluster of data.
|
|