|
Bull Shopping Basics
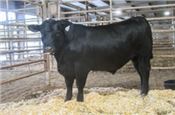
Black Angus bull sold at sale.
ELDON COLE
MT. VERNON, MO.
February is here which signals the beginning of bull sale season. Between now and May there’s a lot of bull sales of all breeds that will be held. Most sales will try to attract you to their auction or private treaty offering with pictures or data.
I’m a believer in objective data and it’s come along way since the first all-breed tested bull sale in Missouri in November 1963. The only “numbers” in the early sales were: adjusted 210 day weight; 140-day average daily gain; adjusted 365-day weight; adjusted loin area at 1000 lbs. and loin area per 100 lbs. body weight. There was a visual grading committee which evaluated the bulls’ appearance at the sale. In the early sales, I suspect more attention was given to this subjective evaluation than the numbers. In fact, that still is valued today by many bull buyers.
However, progressive numbers oriented cattle producers today have a lot of numbers to analyze before they ever go to the sale. The big advancement in using numbers evolved in the 1980’s with expected progeny difference (EPD) values and percentile rank for a wide variety of traits. Then along came genomic testing which boosts the accuracy of EPDs. That boost gives a buyer a feeling of confidence and may allow them to find a bull that has the desired EPDs and accuracy.
I realize some person do not comprehend numbers as well as others. They may even look at an EPD that’s in the 90th percentile and think it’s close to 100 so it must be outstanding. Unfortunately, the 90th percentile places him near the bottom of his breed instead of near the top for that trait.
A popular trend, is to combine several EPD values into indexes. These combined values are expressed in dollars. Most cattle producers have a good grasp of dollars so they can do the math and pick a superior bull for their production system.
The calculation of the index may get a bit complicated as the breed geneticists weight the appropriate traits. For example, Herefords have a Baldy Maternal Index (BMI$) that helps pick Hereford bulls that will be profitable when used in a rotational cross with mature Angus cows. The BMI$ includes cow fertility/longevity, weaning weight, mature cow weight and milk. There is some negative emphasis on dry matter intake. They also have a Brahman Influence Index (BII$) and a Certified Hereford Beef Index (CHB$).
The Angus has a Maternal weaned calf value ($M) that is directly influenced by: calving ease direct, calving ease maternal, weaning weight, maternal milk, heifer pregnancy, docility, mature weight, foot angle and claw set. Each of the nine traits contribute a portion of the value of $M.
Sale catalogs get crowded for space, thus a breed may have 20 or more EPDs and indexes but not include them in every sale. If you feel you’d benefit by having the extra data, contact the owner.
Just when you thought you had all the EPDs, percentile rank, indexes under control and are ready to use it to buy a bull or semen, I tell you there is a new Angus value, $Angus x Jersey and $ Angus x Holstein indexes if you’re breeding the bull to Holstein or Jerseys. Don’t forget $Fescue if you’re looking at Shorthorns.
The bottom line, there is a wealth of objective data to use when making genetic selections. If you receive a sale catalog that interests you, take time to study it before going to the sale. If you don’t understand some of the numbers, contact the breeder, a sales representative or extension specialist and try to understand the objective data. You may not want or need to use all of it but pick and choose the information that helps you make appropriate changes in your breeding program. ∆
ELDON COLE: Extension Livestock Specialist, University of Missouri
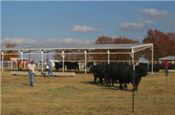
Visual scoring of bulls.
|
|